Link Analysis
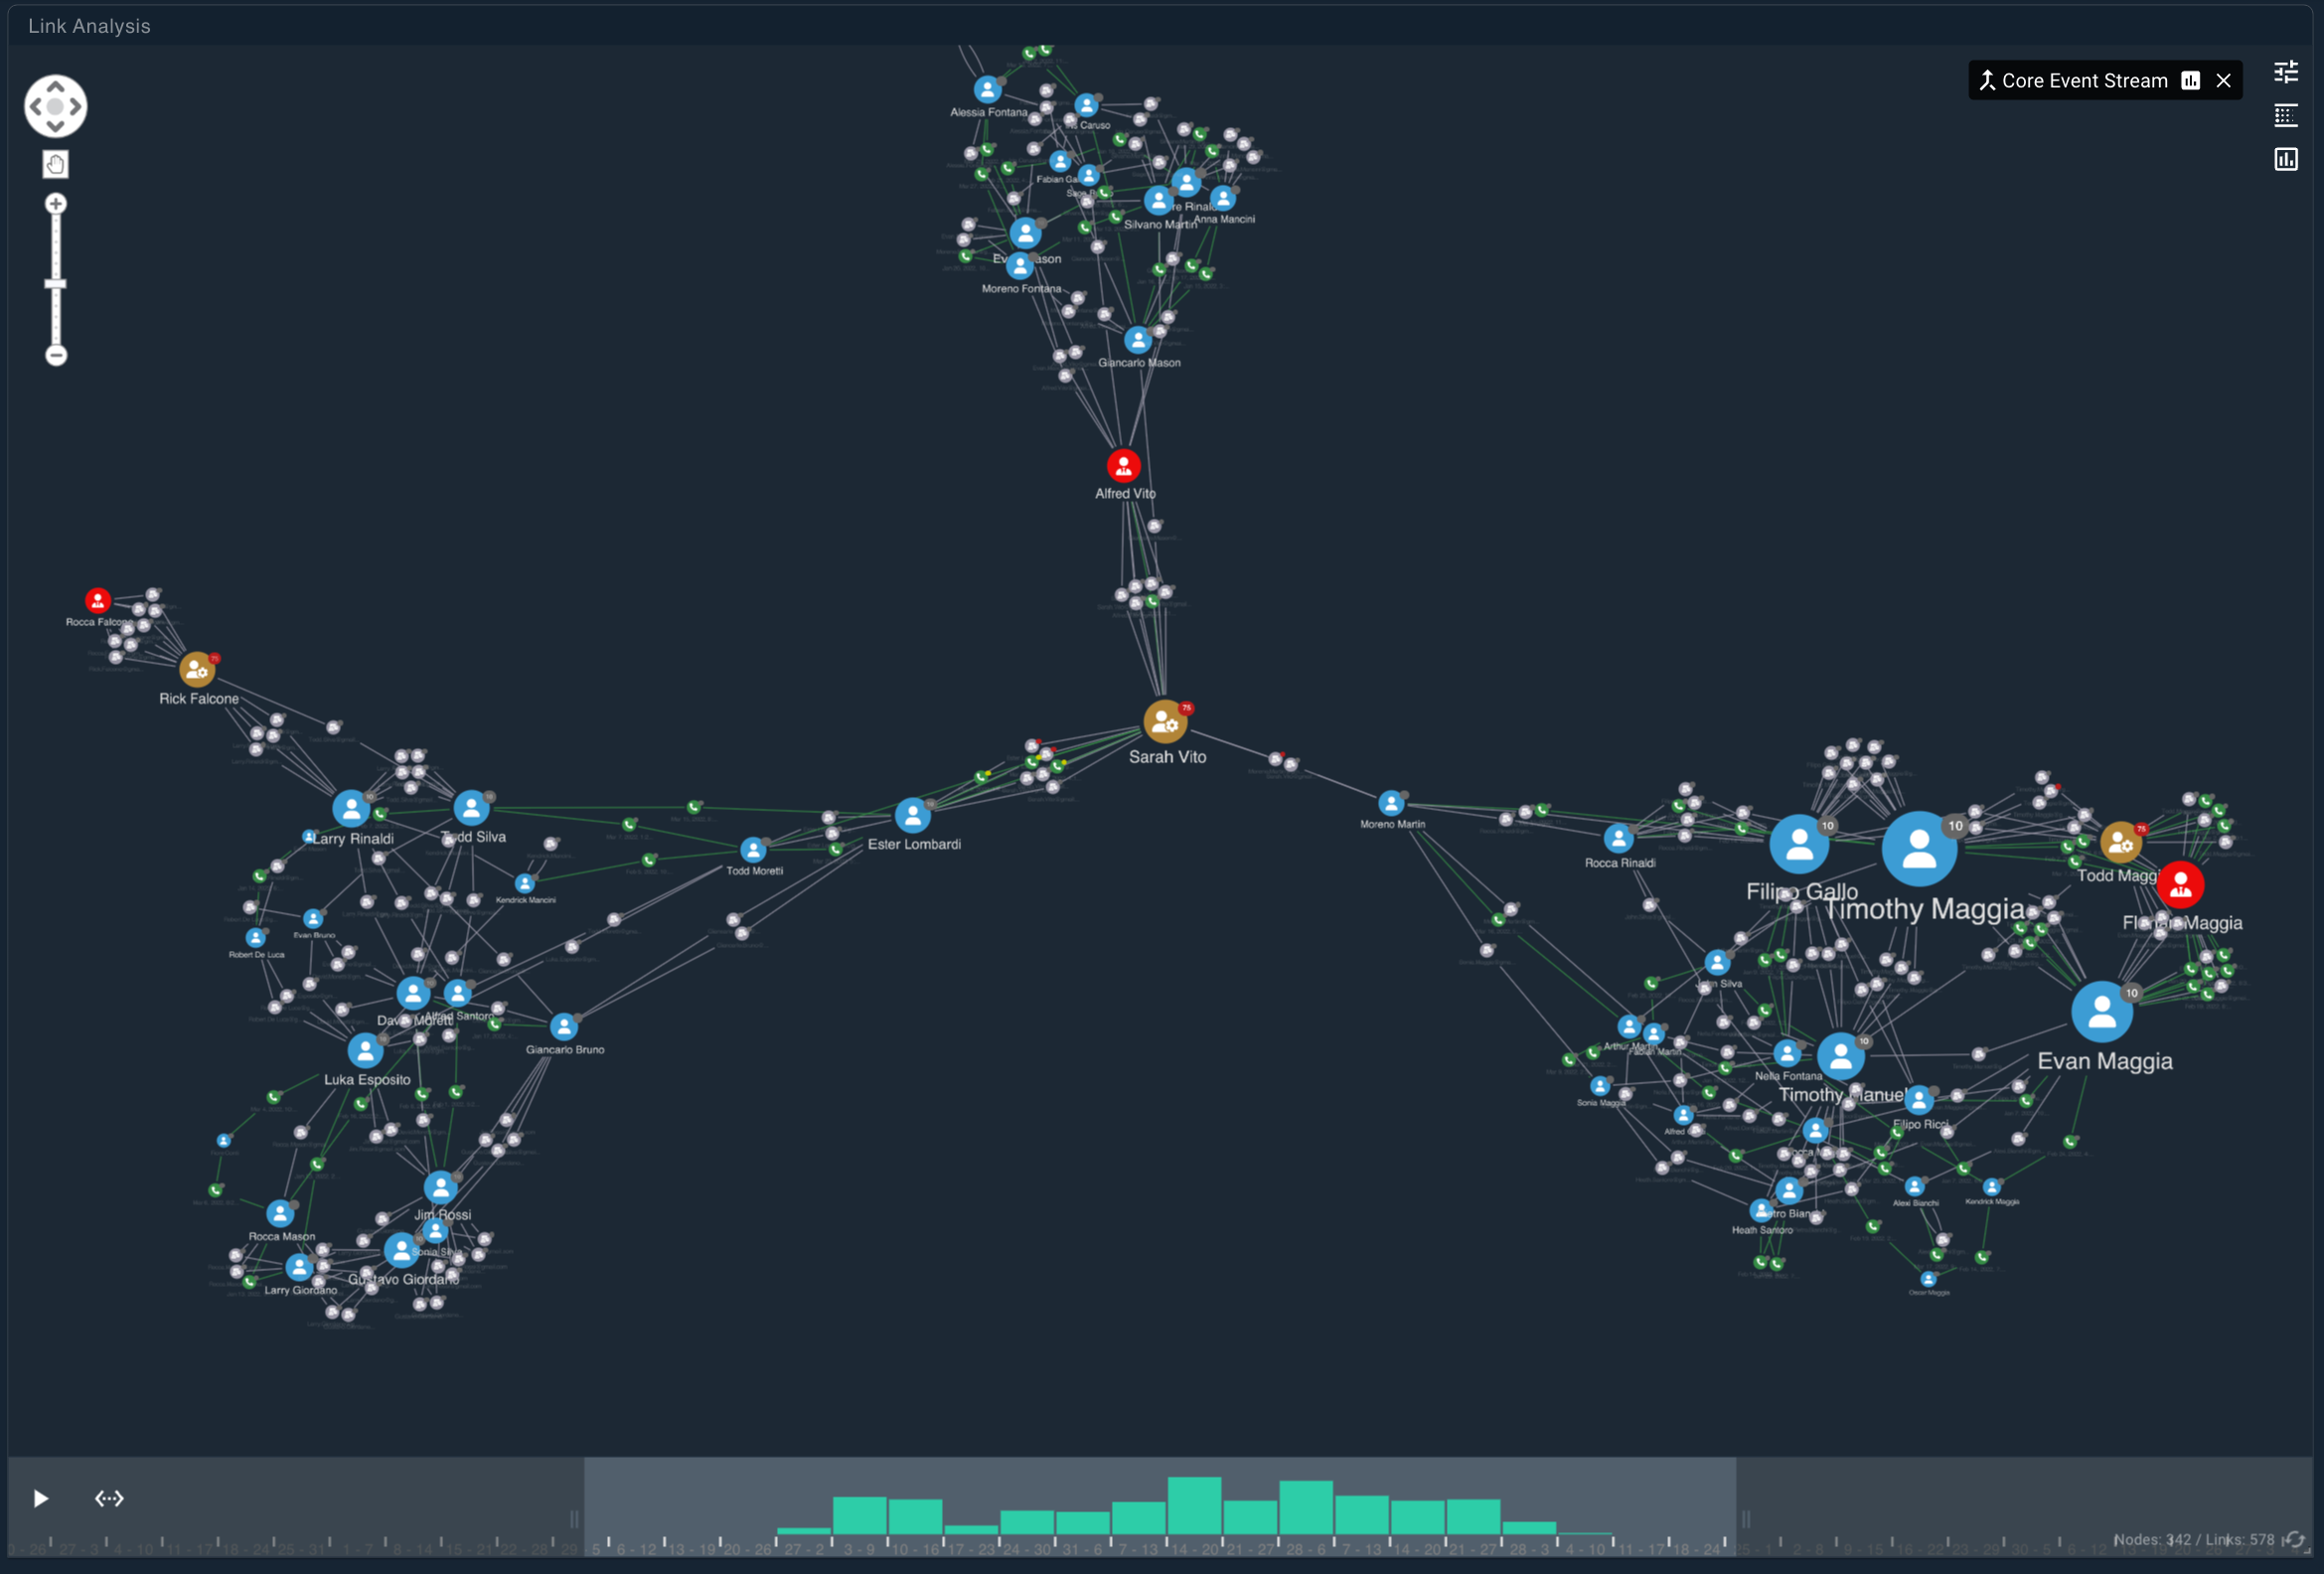
The Link Analysis widget lets you explore how entities are connected by visualizing events as an interactive network graph. Entities appear as nodes and their relationships appear as links, allowing you to quickly understand structure, connectivity, and influence within a dataset.
Link Analysis is most useful for:
- Discovering how entities are related.
- Identifying highly connected or influential nodes.
- Exploring how relationships change over time.
Adding Events to the Link Chart
New events can be added to the chart in the Link Analysis widget as needed.
To add an event to the link chart:
- Add the Link Analysis widget to your workspace.
- Drag an entity or linkage event onto the widget.
- Choose a drop zone (1–4) to control how deeply the network is queried.
- Release to generate the link chart.
Start with a query depth of 1 for large or unfamiliar datasets to avoid clutter and performance issues.
Navigating the Chart
The chart can be repositioned and zoomed as necessary to display the information you wish to see.
- Pan: Drag the background or use the arrow controls.
- Zoom: Use the scroll wheel or vertical zoom slider.
- Select: Toggle between drag and selection modes using the hand/pointer icon.
Expanding the Network
Each node in Link Analysis displays a glyph indicating how many connections it has that are currently not shown on the chart.
Double-click a node to load one additional level of connected entities.
Working with Nodes
The nodes in the Link Analysis widget can be interacted with using the mouse:
- Drag nodes to reposition them.
- Right-click a node to:
- View details.
- Expand or collapse connections.
- Group nodes.
- Remove nodes from the chart.
- Send nodes to Object Details Viewer.
- Right-click the background to reset or clean up the layout.
Highlighting Relationships
Select one or two nodes to highlight how they are connected:
- Click a node to highlight its immediate connections.
- Shift-click a second node to reveal the shortest path between them.
- Click the background to clear the selection.
Configuring the Link Chart
Link Chart settings control how the network is laid out, grouped, and sized. Adjust these options to reduce clutter, emphasize important entities, or improve performance on large graphs.
Settings determine what the link chart shows, how entities can be grouped, and options affecting how the chart is visualized.
Layout options include:
- Standard charts contain nodes with consistent lengths, minimal edge overlap, and even distribution.
- Organic charts feature larger components surrounded by a circle of smaller components to minimize whitespace and overlap.
- Lens charts push highly-connected nodes to the center of the chart, with less-connected nodes outside.
- Structural charts are similar to standard charts, but structural charts group nodes by similarity.
- Tweak charts prevent node additions from subtly changing chart layout. This is useful for datasets consisting of 2,000 nodes or more.
Grouping requires entity and linkage events with groupable data. Any nodes that do not have a field value for the field used in grouping will display outside the grouping.
Group By allows the selection of fields for grouping nodes.
- Grouped nodes render as a summary node containing a count of all grouped events.
- Double-click to expand or collapse a group.
- Multiple field selection is possible, but the order of fields toggled affects the order/level of grouping.
The link chart may become non-performant at a high volume of data (20,000+ nodes). It is recommended to minimally utilize the Group By event definition to maintain performance at high volumes of data.
Show Entities allows analysts to hide or show entity nodes of a particular event type.
Show Linkage Events allows hiding or showing linkage event nodes of a particular event type.
Node Spacing manually adjusts the spacing of nodes. Lower values decrease the space between nodes, while higher values increase the space.
Chart Sizing allows the user to pick the sizing of nodes to use an automatic social network analysis algorithm or manual mode:
- Betweeness measures the number of times a given node lies on the shortest path between other nodes, resizing nodes to indicate bridges between nodes in a network.
- Closeness calculates the shortest paths between all nodes, and then assigns each node a score based on the sum of shortest paths from that node. The node's size reflects this score.
- Degree centrality adjusts node size based on number of links the given node holds, providing a glimpse of one-hop connections to other nodes in the network.
- Eigencentrality measures a node's influence based on the number of links it has to other nodes within the network, as well as that node's extended connections. Useful for visualizing the influence of a given node.
- Page Rank functions similar to Eigencentrality, but takes link direction and weight into account. Useful for uncovering nodes with influence beyond any nodes directly connected to it.
- Manual Sizing is the default selection where nodes are sized based on user defined settings such as entity or link node size.
Entity Node Size manually adjusts the size of entity nodes. Lower values decrease the size of the node, while higher values increase the node's size.
Link Node Size manually adjusts the size of link nodes. Lower values decrease link node size, while higher values increase link node size.
Combine Links attempts to aggregate linkage events between entities based on the number of occurrences of each linkage event between entities.
This feature may not be helpful if the link graph contains linkage events that have more than two entities connected at once.
Link Analysis Over Time
Link Analysis supports time-based exploration when linkage events include an Occurred at timestamp. This allows you to examine how relationships form, change, or disappear over time using two complementary views:
- Time Bar: Filter and animate the network across a specific time range.
- Kronograph: Visualize activity patterns and interaction timelines between entities.
Time Bar
The Time Bar lets you focus Link Analysis on a specific window of time, making it easier to understand how networks evolve.
Enabling the Time Bar
To enable the Time Bar:
- In the upper-right corner of the Link Analysis widget, click the Time Bar icon.
- A time bar appears at the bottom of the widget.
- Click the Time Bar icon again to close it and return to the default view.
Using the Time Bar
Use the Time Bar to observe trends such as increasing connectivity, bursts of activity, or dormant periods.
To control how the Time Bar displays information:
- Zoom the timeline: Hover over the time bar and scroll to zoom in or out.
- Adjust the range: Drag the left or right handles to narrow or expand the time window.
- Play over time: Click Play (▶) to animate network changes across the selected range.
- Scroll while playing to control playback speed.
- Reset: Click Reset Time to include the full available time range.
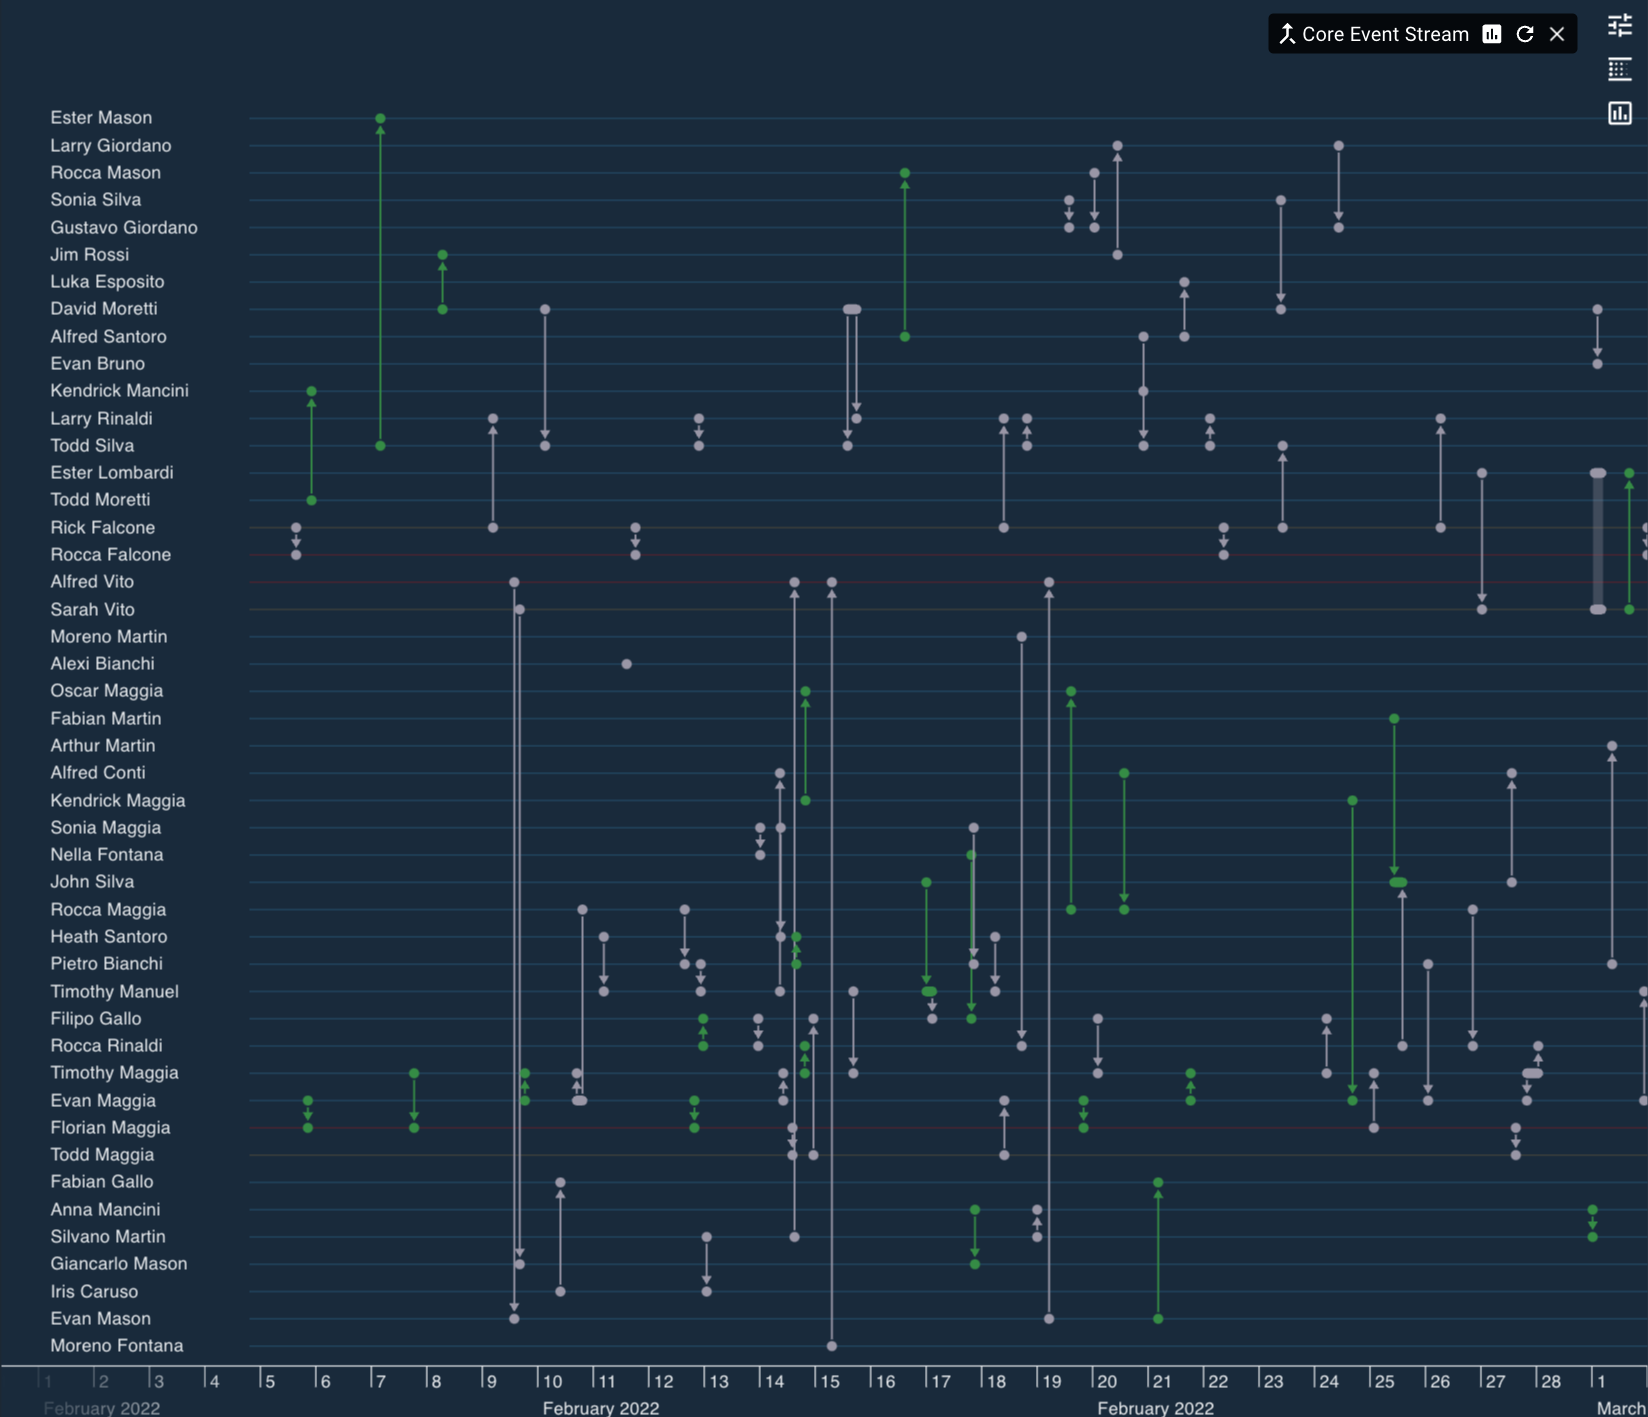
Viewing Patterns of Life with Kronograph
The Kronograph provides a timeline-based view of network activity, helping identify recurring behaviors or interaction patterns between entities.
Enabling the Kronograph
To enable the Kronograph:
- In the upper-right corner of the Link Analysis widget, click the Kronograph icon.
- The view switches to Kronograph mode.
- Click the icon again to return to the standard link chart.
Navigating Time
To maneuver through time using the Kronograph:
- Scroll up to zoom out and view longer time periods.
- Scroll down to zoom in on more precise intervals.
The timeline automatically expands or compresses as you zoom.
Isolating Entities
To focus on particular entities:
- Hover over an entity on the left side of the Kronograph.
- Click the target icon to isolate that entity and its connections.
- Click the target again to clear isolation.
Pinning Entities
To pin an entity in the view:
- Hover over an entity on the left side of the Kronograph.
- Click the pin icon to keep the entity visible regardless of time range or isolation.
- Click the pin again to unpin the entity.
Streaming Mode
The Link Analysis widget can be connected to a single stream of events. When connected, the link chart updates automatically as new events are ingested into Workstation, providing a real-time network graph view of incoming data.
To stream events to the Interactive Map, the map must be connected to the Events Stream:
- Ensure an Link Analysis widget is already added to your workspace.
- Open the Events Stream drawer from the left-hand workspace menu.
- In the top-right corner of the Events Stream drawer, locate the Linkage icon.
- Click and drag the Linkage icon into the Interactive Map widget.
Once connected, the Interactive Map enters streaming mode and continuously updates as:
- New events are ingested.
- Existing events are updated.
- Filters on the connected event stream are changed.
For more information about configuring and filtering event streams, see the Events Stream.